

Introduction
A Data Analyst turns raw information into useful insights that help businesses make better decisions. Moreover, beginners can enter this field by learning Excel, SQL, statistics, visualization, and practical data analysis.
For college students, fresh graduates, and career changers in Chennai, data analytics offers a practical technology career path. Therefore, learning through projects can help beginners understand how analytical skills work in real business situations.
You do not need advanced programming knowledge to start. However, you should develop logical thinking and become comfortable working with numbers and information.
The learning journey becomes easier when you follow a clear sequence. First, understand data fundamentals, then learn analytical tools, and finally practise with real datasets.
Table of Contents
- What is a Data Analyst?
- Why Choose a Data Analyst Career in Chennai?
- Key Modules Covered in Data Analyst Training
- Practical Tools You Master in Data Analyst Training
- How to Build Data Analyst Skills as a Beginner
- Career Opportunities After Completing Data Analyst Training
- Self-Learning vs. Hands-on Training at Infycle Technologies
- Frequently Asked Questions About Data Analyst Careers
- Conclusion
- Final CTA
What is a Data Analyst?
A Data Analyst examines data to identify patterns, trends, problems, and useful business insights.
Simply put, analysts take raw data and turn it into information that people can understand. They may work with sales records, customer information, website traffic, financial data, or operational reports.
For example, a retail company may have thousands of monthly sales records. An analyst can examine that information to identify popular products and changing customer preferences.
Furthermore, analysts often prepare reports and dashboards for managers. These reports can help teams understand performance and make informed decisions.
The role combines technical skills with business understanding. Therefore, beginners should learn both data tools and the ability to explain findings clearly.
Good communication is also important. An analyst may discover an important trend, but the insight has little value if stakeholders cannot understand it.
Why Choose a Data Analyst Career in Chennai?
A Data Analyst career can be a practical option for learners in Chennai who enjoy working with numbers, technology, and business information.
Many organisations collect data from customers, websites, transactions, marketing activities, and internal operations. As a result, businesses need professionals who can organise and interpret that information.
For instance, an e-commerce company can analyse customer orders to understand purchasing behaviour. Similarly, a marketing team can study campaign data to measure performance.
Chennai provides opportunities for students and graduates interested in technology and analytics careers. Moreover, structured training can help beginners develop practical skills before applying for entry-level roles.
Learners from engineering, commerce, science, and other academic backgrounds can begin with the fundamentals. However, consistent practice is more important than having an advanced academic background.
A Data Analytics Course in Chennai can provide a structured learning path. Therefore, learners can progress from spreadsheet analysis to SQL, visualization, statistics, and projects.
Key Modules Covered in Data Analyst Training
A strong beginner curriculum should cover data preparation, analysis, visualization, statistics, and reporting.
First, learners should understand Excel fundamentals. They can then progress to formulas, functions, sorting, filtering, pivot tables, charts, and data cleaning.
Next, SQL becomes an important skill. SQL allows analysts to retrieve information from databases and answer business questions using structured queries.
Moreover, learners should practise SELECT statements, filtering, sorting, grouping, joins, subqueries, and aggregate functions. These concepts appear frequently in practical analytics work.
Statistics provides another important foundation. Beginners should understand concepts such as mean, median, percentage, probability, distribution, and correlation.
However, statistics should not remain theoretical. Learners should apply statistical concepts to datasets and interpret what the results actually mean.
Data visualization is equally important. Tools such as Power BI can transform analysis into interactive dashboards and reports.
For example, a sales dashboard can show revenue, product performance, regional trends, and monthly growth. Consequently, managers can understand important information without reading large spreadsheets.
Practical Tools You Master in Data Analyst Training
Practical analytics training should introduce tools that support data collection, cleaning, analysis, visualization, and reporting.
Excel remains useful for many everyday analytical tasks. Furthermore, SQL helps analysts work directly with information stored in relational databases.
Power BI can help learners create interactive dashboards from different data sources. They can build charts, filters, cards, tables, and other visual elements.
Python can also support analytics workflows. For instance, libraries such as Pandas can help learners clean and analyse larger datasets.
Along with this, learners should understand basic data-cleaning techniques. Missing values, duplicate records, inconsistent formats, and incorrect entries can affect analytical results.
Therefore, data preparation should happen before creating reports. A visually attractive dashboard cannot fix poor-quality source data.
Learners should also practise presenting insights. The final goal is not simply creating charts; it is explaining what the data indicates and why it matters.
How to Build Data Analyst Skills as a Beginner
The best way to build analytical skills is to combine learning, practice, and project work.
Start with Excel and basic statistics. Then move into SQL and data visualization once you understand fundamental concepts.
Moreover, practise with public datasets instead of only following classroom examples. Working with unfamiliar information can improve your ability to identify useful questions.
For example, you could analyse a supermarket dataset and investigate monthly sales, product categories, customer segments, and regional performance.
Next, create a Power BI dashboard from your analysis. This gives you an opportunity to practise data cleaning, visualization, filtering, and presentation.
You should also document your projects. Explain the problem, dataset, analysis process, key findings, and business recommendations.
Furthermore, maintain selected projects on a professional portfolio or GitHub where appropriate. A portfolio can give recruiters a clearer view of your practical capabilities.
Interview preparation should come after consistent practice. Candidates should be ready to explain their SQL queries, dashboard choices, analytical methods, and project findings.
Career Opportunities After Completing Data Analyst Training
Data analytics skills can lead to several entry-level roles across technology, finance, retail, healthcare, marketing, and other sectors.
Beginners can explore positions such as Junior Data Analyst, Reporting Analyst, Business Analyst, Data Visualization Analyst, and MIS Analyst. However, job requirements vary between companies.
Employers may look for Excel, SQL, Power BI, statistics, communication, and problem-solving skills. Some roles may also expect Python or experience with specific databases.
For example, a marketing analytics role may focus on campaign performance and customer behaviour. In contrast, a finance-related role may involve revenue, expenses, forecasting, and reporting.
Project experience can make these skills easier to demonstrate. Therefore, learners should build projects that show how they solved practical problems with data.
A strong portfolio can include sales analysis, customer segmentation, employee analytics, marketing dashboards, or financial reporting projects.
Furthermore, learners can gradually specialise after gaining foundational experience. They may move toward business intelligence, advanced analytics, product analytics, or data science.
Self-Learning vs. Hands-on Training at Infycle Technologies
Self-learning provides flexibility, while hands-on training offers a structured learning path with guided practice.
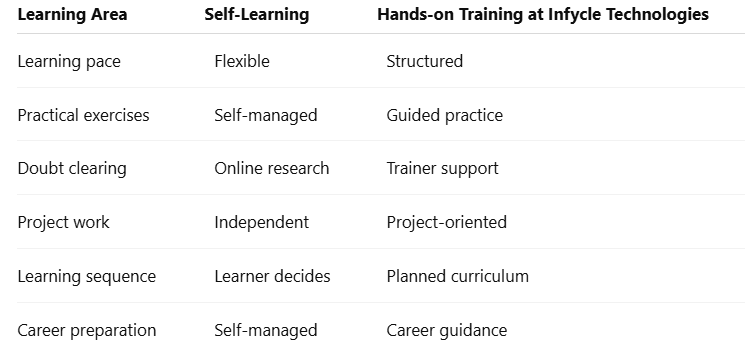
Self-learning can work well for disciplined learners who enjoy exploring resources independently. However, beginners may spend extra time solving technical problems without guidance.
Hands-on training provides regular exercises and trainer feedback. Moreover, project-based learning helps students connect individual concepts into a complete workflow.
Mid-Article CTA
If you want structured analytics learning, Infycle Technologies can help you develop practical skills through guided training in Chennai.
Furthermore, becoming a Data Analyst requires more than learning individual tools. A structured program can help you connect Excel, SQL, Power BI, statistics, and project work into one learning path.
Explore the Data Analytics Course in Chennai to understand the curriculum, practical learning approach, and career-focused training options.
Frequently Asked Questions About Data Analyst Careers
Can a beginner become a Data Analyst?
Yes, beginners can enter data analytics by learning Excel, SQL, statistics, visualization, and practical project development.
What should I learn first to become a Data Analyst?
Start with Excel and basic statistics. Then learn SQL, Power BI, data cleaning, and practical reporting.
Is Python necessary for a Data Analyst?
Python is not always mandatory for entry-level analytics roles. However, learning Python can expand your ability to automate tasks and work with larger datasets.
Is data analytics a good career for freshers?
Yes, data analytics can be a suitable career for freshers who build practical skills and demonstrate them through projects.
Conclusion
Becoming an analytics professional requires a combination of technical knowledge, analytical thinking, communication, and practical experience.
First, build a strong foundation with Excel and statistics. Next, learn SQL and visualization tools such as Power BI.
Furthermore, practise with real datasets and create projects that solve simple business problems. These projects can strengthen your portfolio and improve your interview confidence.
For students and job seekers, the Data Analytics Course in Chennai can provide a structured route from fundamentals to practical projects. Choosing the best software training institute in Chennai can also give learners access to guidance and a planned learning environment.
The key is consistency. Learn one skill at a time, practise regularly, and gradually take on more complex datasets.
Final CTA
Ready to start your data analytics career?
Connect with Infycle Technologies in Chennai for free career counselling and a live demo. Discuss your educational background, career goals, and suitable learning path with the training team.
You can also explore the Data Analytics Course in Chennai to build practical skills in Excel, SQL, Power BI, statistics, and data visualization.
Start small, practise consistently, and build projects that show what you can achieve with data.